Connecting Weather Variability Records to Outcome Distributions in Open-Air Sporting Events
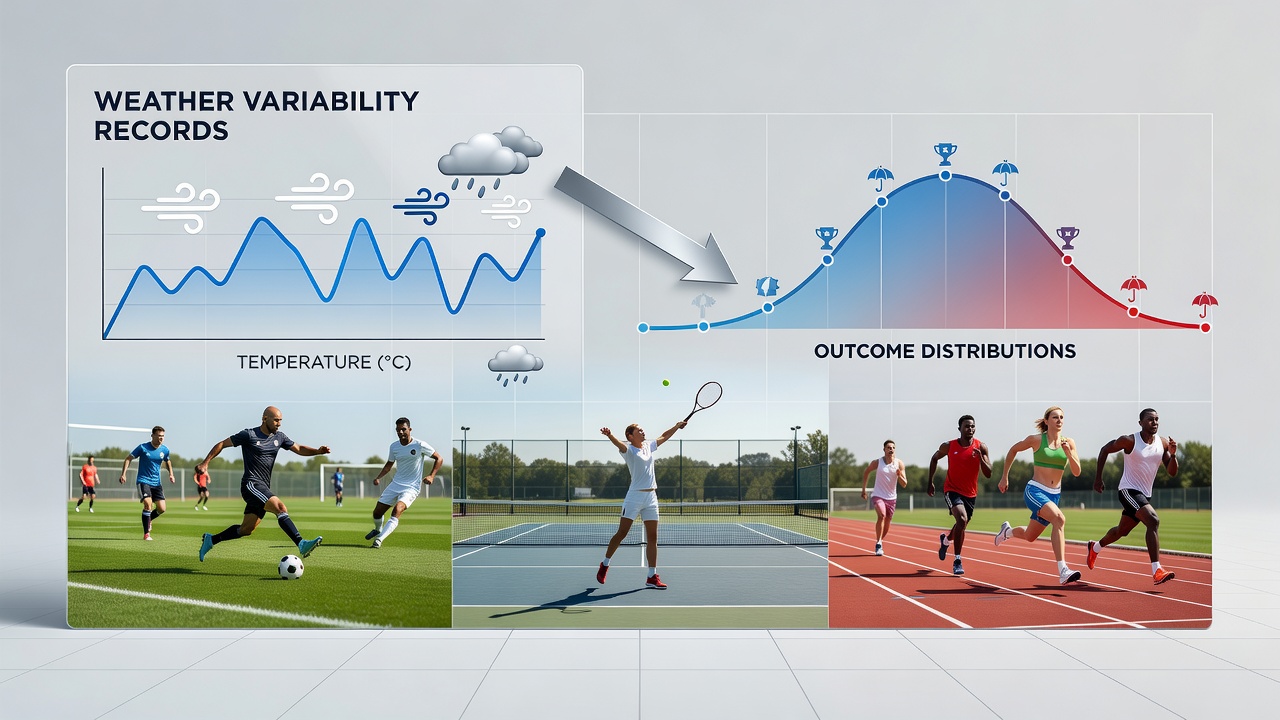
Weather variability records track fluctuations in temperature, humidity, wind speed, precipitation, and atmospheric pressure over defined periods, and researchers connect these datasets to outcome distributions in open-air sporting events through statistical modeling that examines how environmental conditions influence performance metrics such as scoring rates, match durations, and win probabilities across sports including tennis, soccer, golf, and cricket.
National meteorological agencies compile these records using standardized instruments at venues and surrounding areas, which allows analysts to align historical weather data with competition results from leagues and tournaments; the National Oceanic and Atmospheric Administration maintains archives that support such correlations for North American events, while the Bureau of Meteorology in Australia provides comparable datasets for events in the southern hemisphere.
Data Sources and Integration Methods
Organizations integrate weather variability records with outcome distributions by matching timestamped environmental measurements to individual matches or races, then applying regression models that control for athlete-specific factors like ranking and recent form; this approach reveals patterns such as elevated error rates in tennis serves during wind gusts above 25 kilometers per hour or reduced goal conversion percentages in soccer matches when temperatures exceed 30 degrees Celsius for extended periods.
Studies from institutions including the Australian Institute of Sport have examined multi-year datasets from professional circuits, showing that precipitation variability correlates with longer rally lengths in tennis because players adjust shot selection, whereas consistent dry conditions tend to produce more predictable point distributions favoring baseline strategies; these findings emerge from cross-referenced databases rather than isolated observations.
Patterns Across Different Sports
In golf tournaments, wind variability records demonstrate stronger associations with scoring distributions on coastal courses, where sustained breezes above 15 kilometers per hour increase the frequency of shots landing outside fairways and subsequently raise average scores by several strokes over four rounds; analysts track these effects by overlaying hourly meteorological logs onto shot-by-shot data collected through official scoring systems.
Soccer competitions exhibit different linkages, with humidity fluctuations affecting player hydration and sprint distances, which in turn shift the distribution of high-intensity efforts and injury-related substitutions; European and South American league data indicate that matches played under rapid humidity changes often feature altered second-half goal patterns compared to stable conditions, prompting governing bodies to monitor environmental thresholds for scheduling adjustments.
Statistical Approaches and Recent Applications
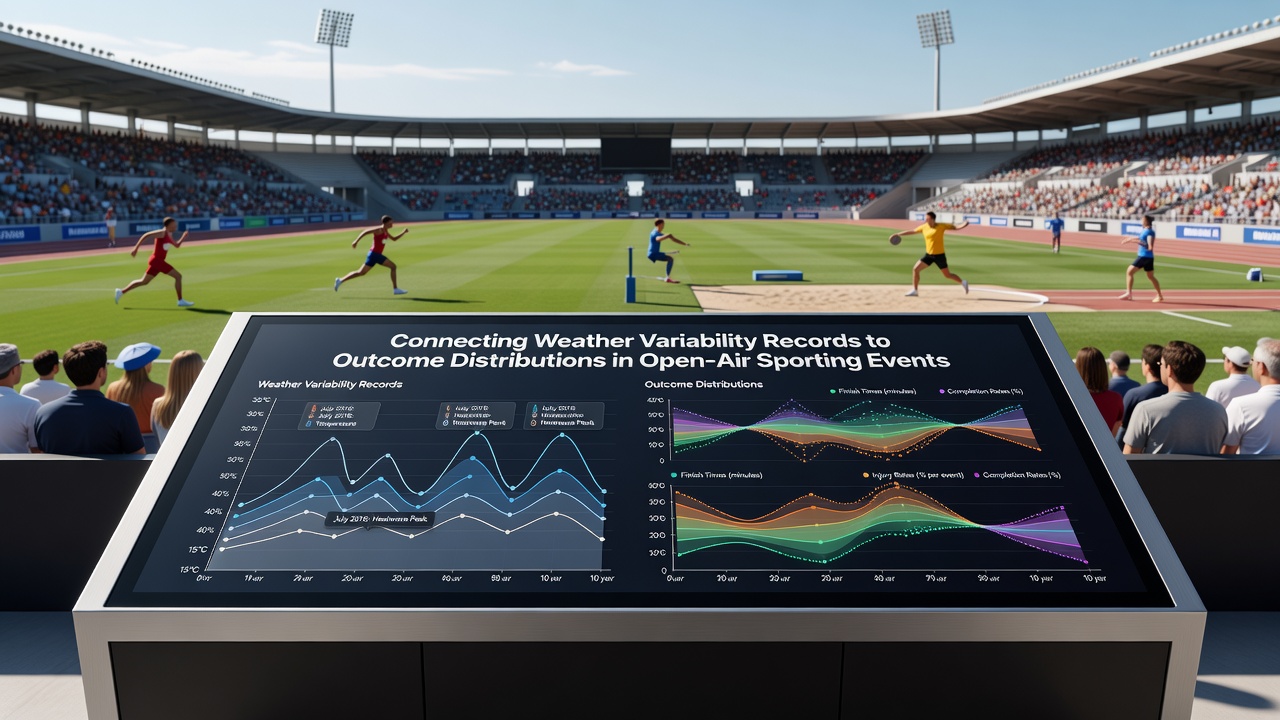
Researchers apply distributional analysis techniques such as quantile regression and kernel density estimation to map weather variability onto outcome spreads, which helps identify thresholds where small environmental shifts produce outsized changes in result probabilities; these methods account for interaction effects between multiple variables, including combined temperature and wind impacts that single-factor studies might overlook.
Events scheduled for September 2026, including several major tennis and golf tournaments, will generate new records as venues deploy enhanced sensor networks that capture sub-minute variability, allowing real-time updates to predictive models; federations have begun incorporating these granular datasets into preparation protocols, enabling teams to simulate conditions observed in prior variability spikes.
Cricket matches provide additional case material because rain interruptions create distinct outcome distributions tied to revised target calculations under the Duckworth-Lewis-Stern method, and historical weather logs from venues in England, India, and the Caribbean show how precipitation timing alters chase success rates in limited-overs formats.
Challenges in Establishing Connections
Establishing causal links between weather variability and outcomes requires large sample sizes because confounding variables such as scheduling changes, athlete adaptation, and equipment modifications can obscure direct effects; multi-site studies that pool data across continents help mitigate these issues by increasing statistical power while maintaining venue-specific controls.
Advances in machine learning now allow models to process high-dimensional weather records alongside performance logs, revealing non-linear relationships that traditional linear models miss, such as threshold effects where moderate wind enhances certain skills while stronger gusts suppress them across an entire distribution of results.
Conclusion
Weather variability records supply measurable inputs that analysts connect to outcome distributions through structured data integration and statistical techniques, producing insights applicable across open-air sports without reliance on anecdotal evidence; continued expansion of monitoring networks and cross-regional datasets will refine these connections as events unfold in coming seasons.